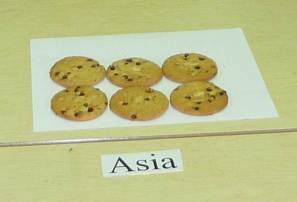
Crystal Thiele, this week’s Educator of the Week, shares a creative way to get students thinking about world population, division of wealth, and immigration…with the help of cookies! Read more about this activity and other ideas for connecting students to the world around them.
Activity: World Population and Wealth Distribution Explained with Cookies
Grade Level: 5-7
Time Commitment: 1 hour
This role-play activity helps students understand the world’s population and division of wealth.
First, the room is divided into clearly labeled continents, with the exception of Antarctica. Then, the each student is assigned a seat in a continent based on its population. Crystal uses this terrific chart she created for reliable population statistics. For example, if there are 30 students in the class than the breakdown will be as follows: Australia (Oceania): 0, Europe: 3, Africa: 5, South America: 2, North America: 2, Asia: 18. Students then discuss what they notice.
Next, cookies are placed in front of each continent of students to represent world wealth based on percentage of world GDP. Crystal uses the same chart to estimate each continent’s GDP. For a class of 30, the treats would be distributed as follows: Australia (Oceania): 1, Europe: 10, Africa: 1, South America: 2, North America: 8.5, Asia: 7.5.

This generates a great deal of discussion, especially when the eighteen students sitting in Asia must share seven and a half cookies and the eight and half cookies in North America all go to two students! Students then graph the data and use it to consider topics such as world migration, war, and inequality.
I have used this activity for a variety of topics, but I currently use it to kick off immigration. We use it as a platform to discuss why people want to move from one area of the world to another and why some areas may create stricter immigration laws because of this.
This activity can be adapted for any class size using Crystal’s statistics chart.

How does this activity impact your students?
It personalizes the amount of inequality in the world and breaks down huge numbers (population, GDP) in a way that allows students to visualize them. Students get very energized in their discussions about how the cookies should be divided up among them or who wants to move where based on the cookie to people ratios in each area. This activity allows them to see why some areas of the world will have more migrants, others more conflict, and even why some places would be anti-immigration. The students are able to consider solutions to the way wealth and population are divided up in the world.
What is one simple activity to get students to think about their world?
Whenever you come across place names in class texts, project a map on board and have students find them on the map. For example, when we read Home of the Brave, a book by Katherine Applegate about a boy from Sudan coming to live in America, we found Sudan on the map, figured out how many miles away it was from us, how long the flight would take, and looked at Google images to see what the scenery was like there.
Why does teaching with this mindset matter to you?
Teaching with a geo-education mindset allows students to see the world as a place made up of people, not just a map with names of places they have trouble pronouncing.
Do you have a favorite quote that inspires you in your life or in your teaching?
“A ship in a harbour is safe, but this is not what a ship is built for.” – John Augustus Shedd
Crystal Thiele is a National Board Certified fifth-grade teacher at PS 321 in Brooklyn, New York, who uses a multidisciplinary, hands-on approach to expanding her students’ view of the world. Previously she taught world studies and science for nine years at the middle school level and ESL for two years in Yamaguchi, Japan. She was also a 2013 Grosvenor Teacher Fellow.
 Do you know a great educator who teaches about our world? Nominate a colleague or yourself as the next Geo-Educator of the Week!
The Educator of the Week series features inspiring activities and lessons that educators are implementing with their students that connect them to the world in bold and exciting ways.


2 thoughts on “Featured Activity: World Population and Wealth Distribution Explained with Cookies”